
Impact reports
2026 month by month.
Follow documented community impact as each reporting cycle closes, with clearly labeled modeled estimates for the earlier months of 2026.
Year-to-date view
Documented results and a transparent estimate.
The documented July and August reports total $392,649.74 and average $196,324.87 per completed cycle. That average is applied to January–June only to provide a consistent year-to-date estimate.
$392,649.74Documented totalJuly and August combined.
$196,324.87Two-cycle averageUsed only to model January–June.
$1,570,598.96Estimated January–August totalSix modeled months plus two documented months.
Measurement note: These amounts represent estimated retail community-impact value, not cash revenue or expenditures. January–June are modeled estimates, not reconstructed transaction records. The September 13–October 10 cycle remains open and is excluded.
2026 month by month
Each month, with its reporting status.
February
$196,324.87March
$196,324.87April
$196,324.87May
$196,324.87June
$196,324.87July
$241,242.56View July graphic →August
$151,407.18View August graphic →September
In progressSeptember 13–October 10 activity will be posted after the reporting cycle closes.
Completed report archive
Published graphics and verified breakout details.
Each completed cycle includes its approved visual report and a separate detailed PDF breakout.
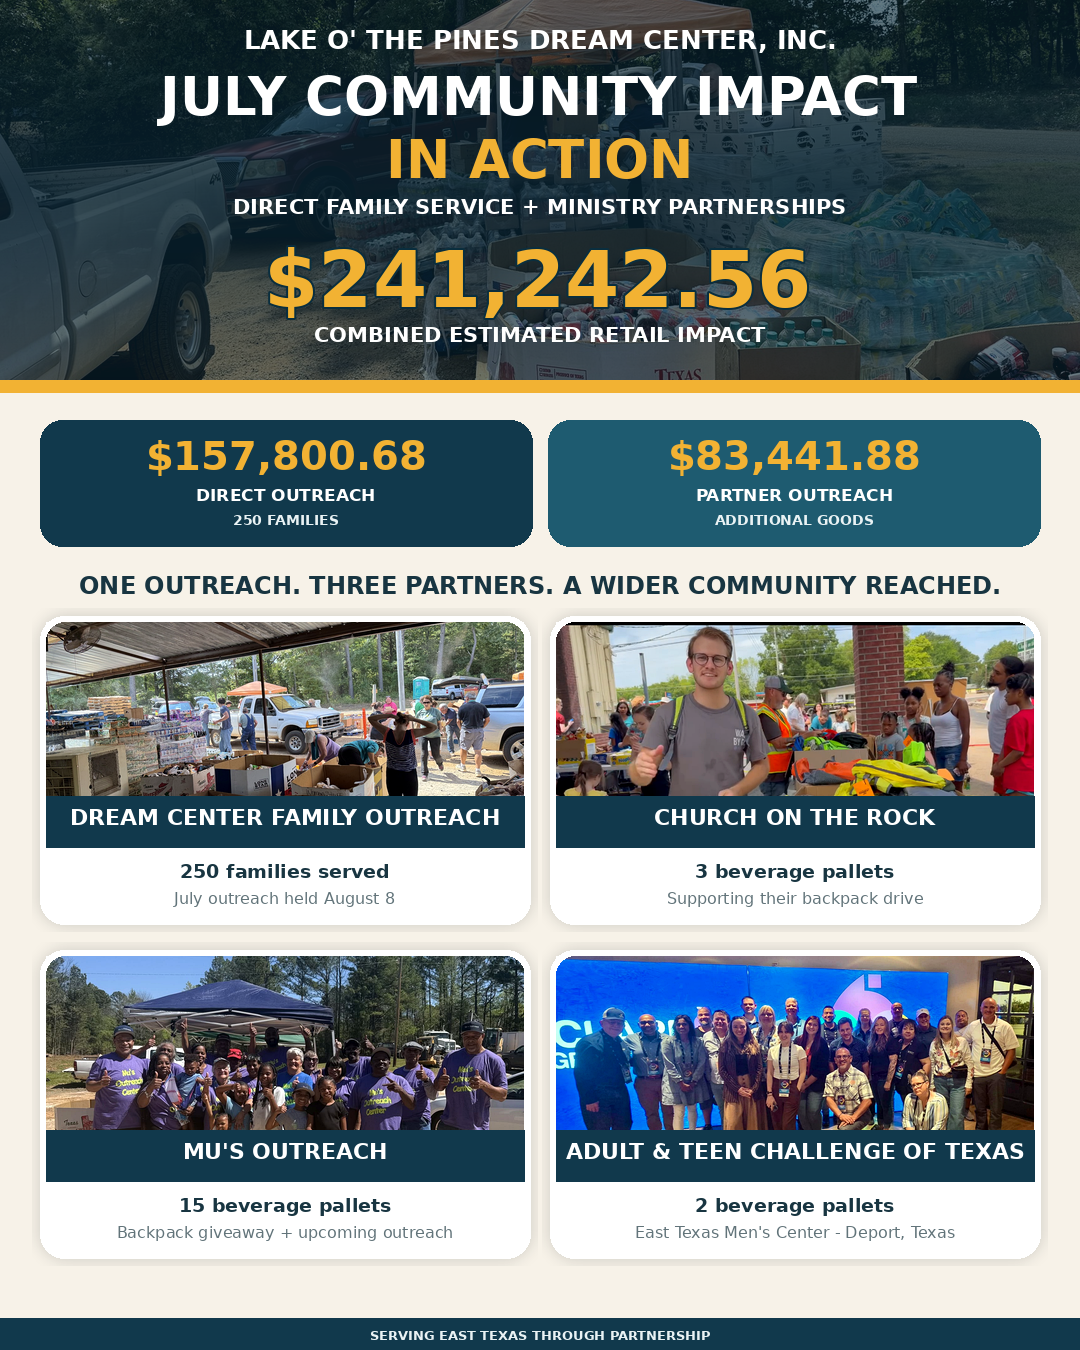
July 2026$241,242.56
Direct family outreach$157,800.68250 families served at the August 8 outreach
Twenty partner beverage pallets$82,499.38Mu’s Outreach: 15 · Church On The Rock: 3 · Adult & Teen Challenge of Texas: 2
Additional partner goods$942.50Reconciled balance within the documented partner-outreach total
Total partner outreach$83,441.88Twenty beverage pallets plus additional goods
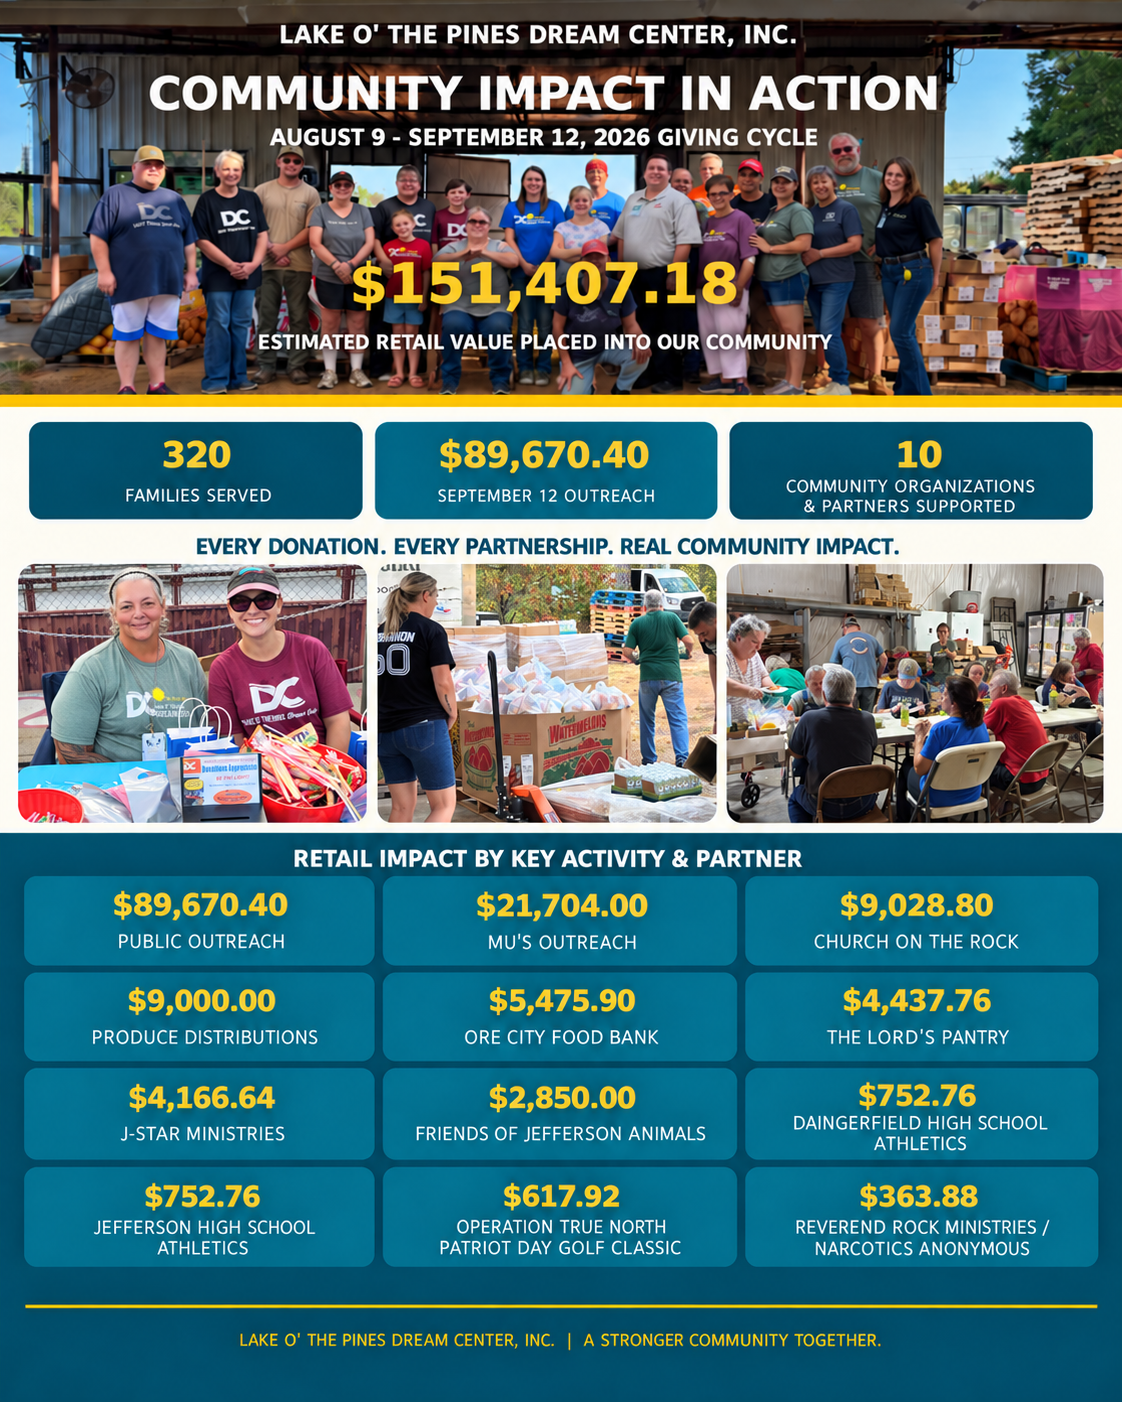
August 9–September 12, 2026$151,407.18
$89,670.40 at the September 12 outreach, 320 families served, and 10 community organizations and partners supported.
Questions?